About the Data
Background
The National Study of Nutrient Removal and Secondary Technologies (Nutrient Removal Study) Screener Questionnaire was a voluntary, online questionnaire issued to 16,500 publicly owned treatment works (POTWs) across the United States, including territories. Between 2019 and 2021, more than 2,200 facilities responded. To be eligible to respond to the full questionnaire, facilities had to meet three criteria:
- The facility is a treatment works used for the storage, treatment, recycling, and/or reclamation of municipal sewage.
- The facility is publicly owned.
- The facility is physically capable of directly discharging treatment system effluent to a surface water.
More than 2,000 eligible facilities responded to the questionnaire.
The Screener Questionnaire collected information for calendar year 2018 on topics including:
- Facility demographics (e.g., location, flow rate)
- Wastewater contributions
- Wastewater treatment technologies
- Collection system and discharge practices
- Historic and future plant operational changes and upgrades
- Monitoring locations, nutrients monitored, and annual average concentrations.
A selection of results is displayed in the Nutrient Removal Study Dashboard.
Top of Page
Screener Questionnaire Size Definitions
In the Screener Questionnaire, POTWs were presented different sets of questions based on facility size. All POTWs were presented the same questions on facility demographics and flow rates. Small POTWs were defined as those reporting a population served that is less than 750 individuals and a design capacity flow less than 1 million gallons per day (MGD). Small POTWs received fewer questions and did not provide effluent data or information on past or future modifications to improve nutrient removal.
Large POTWs, serving more than 750 individuals and/or having a design capacity flow greater than 1 million MGD, were asked to respond to the full questionnaire.
The Dashboard presents results for the 1,691 Large POTWs.
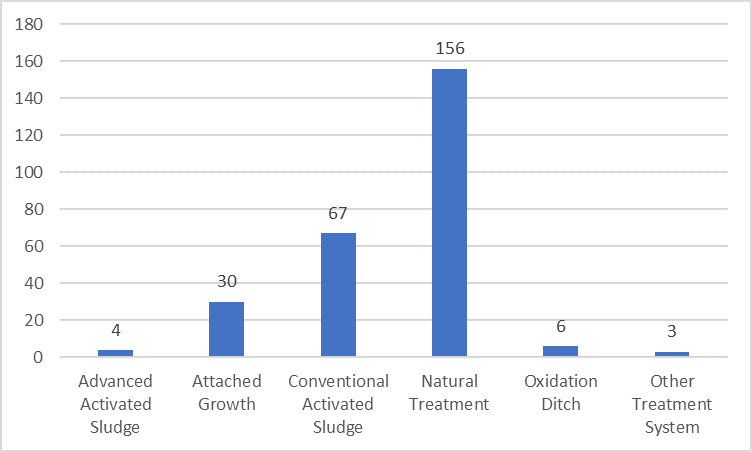
Because small POTWs were not asked to provide the information on the Dashboard, the figure below presents biological treatment types operated in 2018 as reported by 261 Small POTW respondents (Nature treatment refers to systems such as lagoon treatment systems, constructed wetland systems, etc.). The median reported daily flow (i.e., average daily flow or total daily flow) for these facilities is 0.02 million gallons per day (MGD).
Within the Screener Questionnaire, respondents were able to select as many treatment types as applicable to their POTW. As such, individual POTWs may use more than one treatment type, in parallel or in series. All Small POTW responses are displayed in this chart.
Top of Page
Data Considerations
EPA did not conduct respondent follow up to confirm questionnaire responses or request clarification on unclear or incongruous responses. Results in the Dashboard are presented exactly as submitted by respondents.
Some respondents did not complete their questionnaire response within the allotted timeframe. EPA retained response data from incomplete questionnaires and included these data in the Dashboard. As such, not all 1,691 Large POTWs responded to every question.
Within the Screener Questionnaire, respondents were asked to voluntarily report nutrient monitoring data by selecting from the list of ranges shown on the Dashboard. The questionnaire requested measurements from two locations that both could be considered effluent depending on POTW configuration: Treatment System Effluent (at the end of the system designed to provide physical, chemical, and/or biological treatment) and Final Outfall (where wastewater discharge leaves the facility). Results in the Dashboard prioritize measurements from the Final Outfall and only present measurements from the Treatment System Effluent where Final Outfall data were not reported. POTWs with more than one outfall were instructed to use the primary outfall to answer this question.
When reporting nutrient monitoring data, respondents were asked to indicate the units of measurement in which their data were reported. For example, for ammonia, respondents were asked whether their data were reported in milligrams per liter (mg/L) “NH3 as N” or mg/L “other.” The questionnaire did not request a description of other units. For presentation in the Dashboard, all results were included and are simply displayed in mg/L.
Top of Page